Tuesday, May 26, 2015

Rainy Memorial Day Weekend

Bunkers took the most damage
However, the staff was able to repair them quickly


I toured the golf course this morning after a rain filled Memorial Day weekend, and was pleased to see very little damage, other than bunkers.  A total of 5" of rain fell over the weekend, which puts us at 13.50" thus far this month.  The staff, began putting bunkers back together yesterday, for the sixth time, and finished this morning.  The good news is that, although the ground is saturated and there is standing water in many places, the drainage we do have worked very well.  It seems the course handled the heavy rain very well and the only place you can tell we had an extreme amount of rain is the high water mark in the tunnel, and some debris along creek banks.  If we can dry out for a few days, and mow, we should be in good shape.  There is more rain scheduled for tomorrow through Friday.  Lets hope we miss some of it, we don't need any more for awhile.

The grass is laid over from the water flowing over the banks

Besides being wet, the course faired well

It's Official, Wettest Month in State History

As you can see from the title, we've already broken a 74 year old record for wettest month on record, and we still have more rain forecasted in the next week.  Here is some more great information from the Oklahoma State Climatologist, Gary McManus:

MESONET TICKER ... MESONET TICKER ... MESONET TICKER ... MESONET TICKER ...
May 26, 2015       May 26, 2015       May 26, 2015       May 26, 2015       


Mad May

http://ticker.mesonet.org/archive/20150526/madmay.png

Well, whenever post-apocalyptic madmen start releasing water, you know things
have gotten pretty bad. For those of you that missed the Ticker on Sunday, yes,
we have eclipsed the record for wettest May AND month for the state of Oklahoma.
After all the shenanigans this weekend, the statewide average for the month
thus far stands at 12.93".

12.93"!!!!!!

http://ticker.mesonet.org/archive/20150526/may1-26-totals.png
http://ticker.mesonet.org/archive/20150526/may1-26-pct.png
http://ticker.mesonet.org/archive/20150526/may1-26-stats.png

So our list of wettest Oklahoma months has a new sheriff in town, and we replace
that sheriff with each drop of water that falls between now and 11:59pm, May 31,
2015.

May 2015: 12.93"
Oct 1941: 10.75"
May 1957: 10.54"
May 1982: 10.38"
May 1943:  9.66"
Jun 2007:  9.51"
May 1902:  9.14"
Jul 1950:  9.07"

Again, we didn't just beat the previous record, we absolutely SMASHED it in this
"probably" El Nino-fueled enhanced southerly storm track with wide-open
moisture flow from the Gulf of Mexico. And it's not just Oklahoma, obviously.
This type of pattern impacts the entire Southern Plains.

http://ticker.mesonet.org/archive/20150526/last30days-SP.png

The good news is that the drought, for all intents and purposes, is over for
the bulk of the state. Most lakes are full or overflowing, some to the point
of catastrophe. Speaking of catastrophe, the bad news is that widespread river
and flash flooding has wreaked havoc on lives and property over nearly all parts
of Oklahoma. According to the OK Dept. of Emergency Management, 9 storm-related
deaths have occurred since May 5, in addition to 49 injuries.

More bad news, the rain and severe weather chances are not finished. The 7-day
rainfall forecast does not bode well for those areas of the state already
underwater or filled to capacity in soils, creeks and reservoirs.

http://ticker.mesonet.org/archive/20150526/7day-rainfall-forecast.gif

In early April, we would have killed for that type of rainfall forecast. Now, in
a cruel twist of fate, that type of forecast could literally kill. Severe weather
chances will go up again today. We'll let our friends at the local NWS offices
paint that picture.

http://ticker.mesonet.org/archive/20150526/nws-amarillo-svr.jpg
http://ticker.mesonet.org/archive/20150526/nws-norman-svr.jpg
http://ticker.mesonet.org/archive/20150526/nws-norman-svr-timing.jpg
http://ticker.mesonet.org/archive/20150526/nws-norman-tornado-pot.jpg
http://ticker.mesonet.org/archive/20150526/nws-tulsa-svr.png

And just in case you haven't noticed, it's been kind of chilly as well. I believe
we have probably set a few records for record low maximum temperatures over the
last several days. One of the things you'll see in a rainy month during the
warm season is a suppression of the high temperatures and little impact on the
low temperatures. The reason is pretty simple...the clouds and moisture act as
a shield to the suns rays during the daytime (hence, lower than normal high
temperatures) and a blanket at night, trapping heat that would normally radiate
away from the surface (hence, the preservation of the low temperatures). That's
exactly what we see in the Mesonet data for May thus far.

May 1-25 Statewide Average Mesonet Temperatures
           Tmax     Tmin     Tavg
Measured   74.3     55.8     64.7
Normal     78.9     55.8     67.4
Departure  -4.6      0.0     -2.7

The highest temperature we've seen on the Mesonet for May this year is 91
degrees at Altus back on the 18th. The high temperature at Woodward on the 20th
was 54 degrees, for crying out loud! That's like March, not May.

Some would say the lack of significant heat has saved us from an even worse
bout with severe weather, although the tornado numbers are stacking up. The
Norman NWS office has 32 twisters listed for May thus far, with 2 in April and
6 in March for a total of 40. Average for Jan-May is 38.4, so we're on track
to be above average thus far. That total of 40 will definitely be going up as
they investigate more damage paths.

The best news I've seen is the latest CPC precipitation outlook for June 2-8.

http://ticker.mesonet.org/archive/20150526/precip-outlook-jun2-8.gif

Increased odds for normal precipitation. I'll take it.

"What a lovely day!!" that will be.

Gary McManus
State Climatologist
Oklahoma Mesonet
Oklahoma Climatological Survey
(405) 325-2253
gmcmanus@mesonet.org

Friday, May 22, 2015

More Information on Recent Weather

For those interested, here is some great information from the Oklahoma state climatologist, Gary McManus, about our recent storms and their effect on drought and resevoir levels.  I think it's interesting and worth sharing.

A Momentous Drought Monitor Map!

When you have rainfall amounts like this

http://ticker.mesonet.org/archive/20150521/30day-rainfall.png

and this

http://ticker.mesonet.org/archive/20150521/60day-rainfall.png

and soil moisture maps like this

http://ticker.mesonet.org/archive/20150521/2inch-soilmoisture.png
http://ticker.mesonet.org/archive/20150521/10inch-soilmoisture.png
http://ticker.mesonet.org/archive/20150521/24inch-soilmoisture.png

and a reservoir storage map that went from this

http://ticker.mesonet.org/archive/20150402/march23-reservoir-storage.jpg

to this

http://ticker.mesonet.org/archive/20150521/may19-reservoir-storage.png

is it any wonder that the U.S. Drought Monitor map for Oklahoma went from this

http://ticker.mesonet.org/archive/20150521/april14-DM-map.png

to this

http://droughtmonitor.unl.edu/data/pngs/20150519/20150519_OK_trd.png

in little over a month?

And what a momentous map that is (hence the title of the Ticker)! For the first
time since March 8, 2011, ZERO extreme or exceptional(D3 or D4) drought is
displayed within Oklahoma's borders.

http://ticker.mesonet.org/archive/20150521/march8.2011-DM.png

That map from March 8, 2011, still shows a state with 82% depicted as having
at least moderate drought, but the difference is that was when this 2010-15
drought was just beginning to intensify. The current map shows a drought which
is dying, and dying rather rapidly.

Before March 8, 2011, the previous time Oklahoma was noted with at least extreme
drought was back on August 12, 2008, in the far western Panhandle. Let's hope
the wait this time is much longer for its return, although 3 years or so isn't
bad.

http://ticker.mesonet.org/archive/20150521/aug12.2008-DM.png

Now the worst map in the history of the Drought Monitor for Oklahoma, going by
the amount of extreme-exceptional drought, occurred on August 7, 2012, with
97% of the state in at least extreme drought. Ugh, what an ugly shade of red
(shout-out to my OSU partners...that's a freebie!).

http://ticker.mesonet.org/archive/20150521/aug7.2012-DM.png

Although I still believe the map from October 4, 2011, with 70% of the state in
EXCEPTIONAL drought was probably the drought at its peak.

http://ticker.mesonet.org/archive/20150521/oct4.2011-DM.png
 
Now, if you're still worried by drought, or by a low lake, or by going almost
two days without flooding rainfall...give it a minute. Help is on the way. If
not this week, then possibly the next.

http://ticker.mesonet.org/archive/20150521/7day-rainfall-forecast.gif
http://ticker.mesonet.org/archive/20150521/may28-june3-precip-outlook.gif

Hey, we should have cake! Wet, soggy, water-logged cake.

Gary McManus
State Climatologist
Oklahoma Mesonet
Oklahoma Climatological Survey
(405) 325-2253
gmcmanus@mesonet.org 

Friday, May 15, 2015

Is this Seattle?


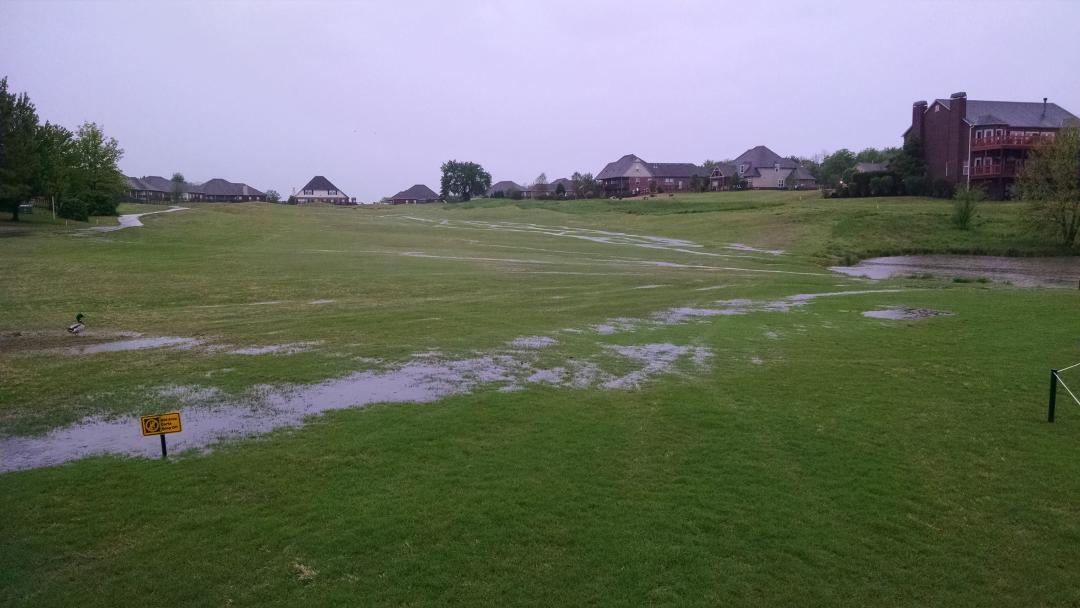
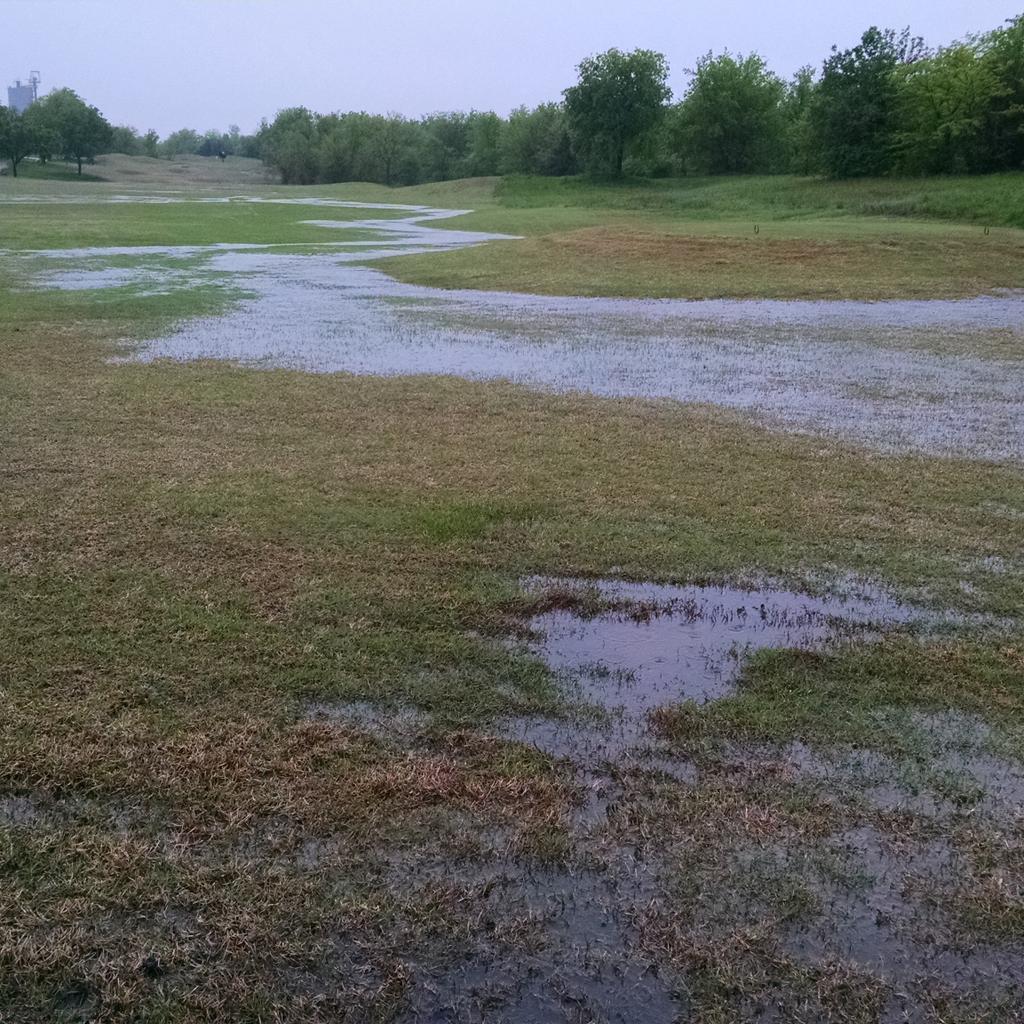
The cloudy, rainy weather has been the big topic
lately.  It seems that so far this spring, the sun just doesn't want to come out.  Now, we always expect a fair amount of clouds and rain, but this year has been exceptional.  According to the National Weather Service in Tulsa, it has rained 25 out of the last 44 days since April 1st.  That's an amazing 57% of the time.  As you'd imagine, this coincides with our rainfall totals being ahead of pace for the year.  Based on the average monthly rain totals, we should be at 14 inches so far for the year.  As of today, we are just over 20 inches for the year.

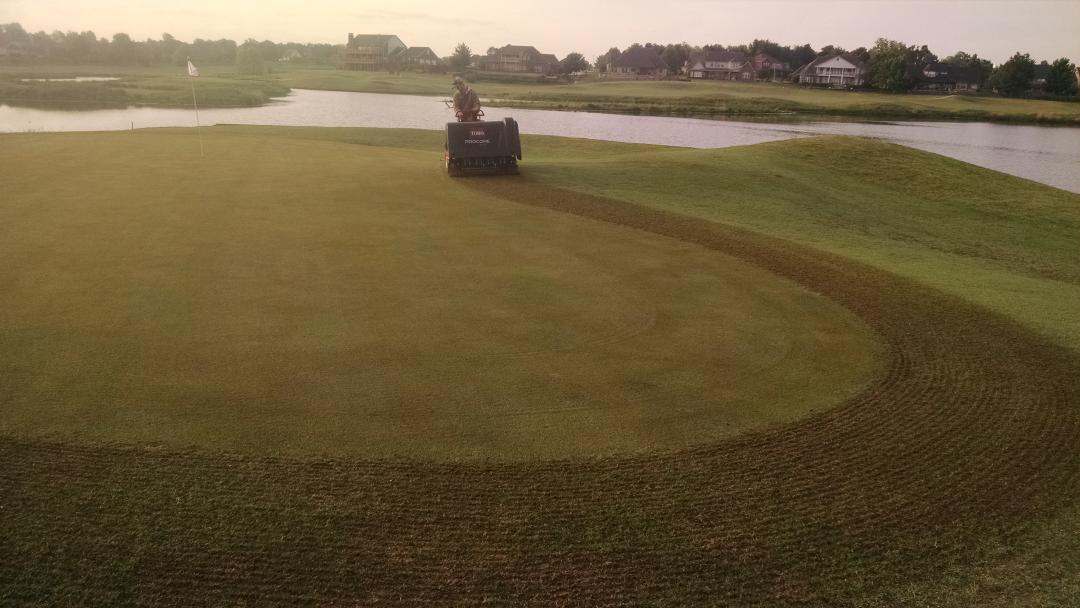
Wherever there's rain, there's clouds.  Since April 1st, we've had at least 50% cloud cover 84% of the time.  This almost constant presence of clouds has had a serious impact on the overall health of our Bermudagrass.  As has been discussed before, Bermuda requires 8 hours of direct sunlight to reach it's maximum growth potential.  Since the grass woke up from dormancy in late March, it hasn't been able to create enough energy on its own.  Therefore, the turf's density and color are poor and the golf course hasn't reached it's full potential.  I expect this weather pattern to break sometime in the next few weeks a more normal summer weather pattern to take hold.  The staff has been busy fertilizing the Bermuda to encourage it as much as possible, but fertilizer will only go so far without heat and sunlight.  Once we get into June, the temperatures go up, and the sun comes out, the golf course will look great.

Wednesday, May 6, 2015

Collar Aeration

Embedded image permalink
Kyle getting an early start on #17 collar
Yesterday, the grounds staff core aerated two passes around the outside of every green.  This process involves using 1/4" tines set very close together to produce numerous tiny holes. As you can see from the picture above, there is minimal debris left behind.  These pea size tufts of grass and soil are easily broken up by the metal drag mat that follows.  Once the cores are broken up and the sand is drug back in, the thatch left behind is blown off into the rough.  After the mat and blower is finished, it is very difficult to see that we were ever there.
Jon fertilizing #13 collar last week

This aeration, coupled with our fertilizer application last week, will encourage rapid recovery and fill-in of the collars.  This process will also ensure long term turf health by reducing compaction, increasing oxygen content in the soil and improving drainage capacity.  Our goal is to get the collars back to the condition expected by our members and guests as quickly as possible.